Debugging a Business Process Model |
|
The Process Debugger helps you test a business process step-by-step and trace any problems that occur during execution. The Process Debugger has two modes of operation:
- Run Interactively: This mode gives a view of how the business process is executed.
- Debug: This mode provides additional options such as viewing and changing input and output messages. You can start this mode using the Process Instance Manager (PIM).
Note:
If there are any parallel flows in a business process they will be executed in parallel during runtime, although in the Process Debugger, the process is debugged in a sequential order.
- Select a starting point and click
 (Business Process Model) to open a business process model. If you have the business process model already opened in the business process modeling environment, then perform step 2.
 - Right-click in the Process Platform business process modeling environment and select Business Process Execution > Debug. Alternatively, right-click the process model in the Process Platform menu and, select Business Process Execution > Debug. The Process Debugger window appears.
- Select the Execute Method check box to execute SOAP applications in the process. This check box is selected by default. If you clear the check box, the output message is generated from the application WSDL, and the output parameter is displayed in the Message tab. In this case, you can also type the output parameters manually.
- Select the Send Notifications to Users check box to send notifications to users' Inbox. If the check box is not selected, notifications are displayed in the Process Debugger.
- Select the Step into Subprocess check box to debug activities in the sub-process. This check box is selected by default. If you uncheck this option, the sub-process will not be executed by the debugger and you will need to hard-code the output message (if any) of the sub process in the main process message map.
- Click Process Options on the toolbar in the business process modeling environment and select an option. Refer to Process Debugger Toolbar for more information on the options in the Process Debugger. The Process Debugger starts debugging the business process model.
Note:
In the Process Debugger window, the Process Name section shows the description of the business process model.The Status section shows information on the status of the business process model (whether it is waiting for input or giving some information.)
The Message tab displays the messages sent or received. The message can be an Input Message, Output Message, or Assignment. The name of the tab varies depending on whether it is an Input Message or an Output Message. The Message Map tab displays the complete message map until the point of execution of the Business Process. While editing an activity, you must indicate the changes in the Message Map tab and not the Message tab.
The business process is debugged.
Example of Debugging a Business Process
The following example describes the procedure to debug the Stock Replenishment process. The process is designed to retrieve product information and check if the product reorder level is reached and inform the Purchase Manager to reorder stock.
- Select a starting point and click (Business Process Model) to open an existing business process model. From the Workspace Documents (Explorer) window, click <project> > <StockReplishmentBPM>. The business process model appears in the process modeling environment.
- Right-click in the Process Platform business process modeling environment and select Business Process Execution > Debug. The Process Debugger window appears.
- Click the Activity by Activity icon (
 ) or the Step by Step icon (
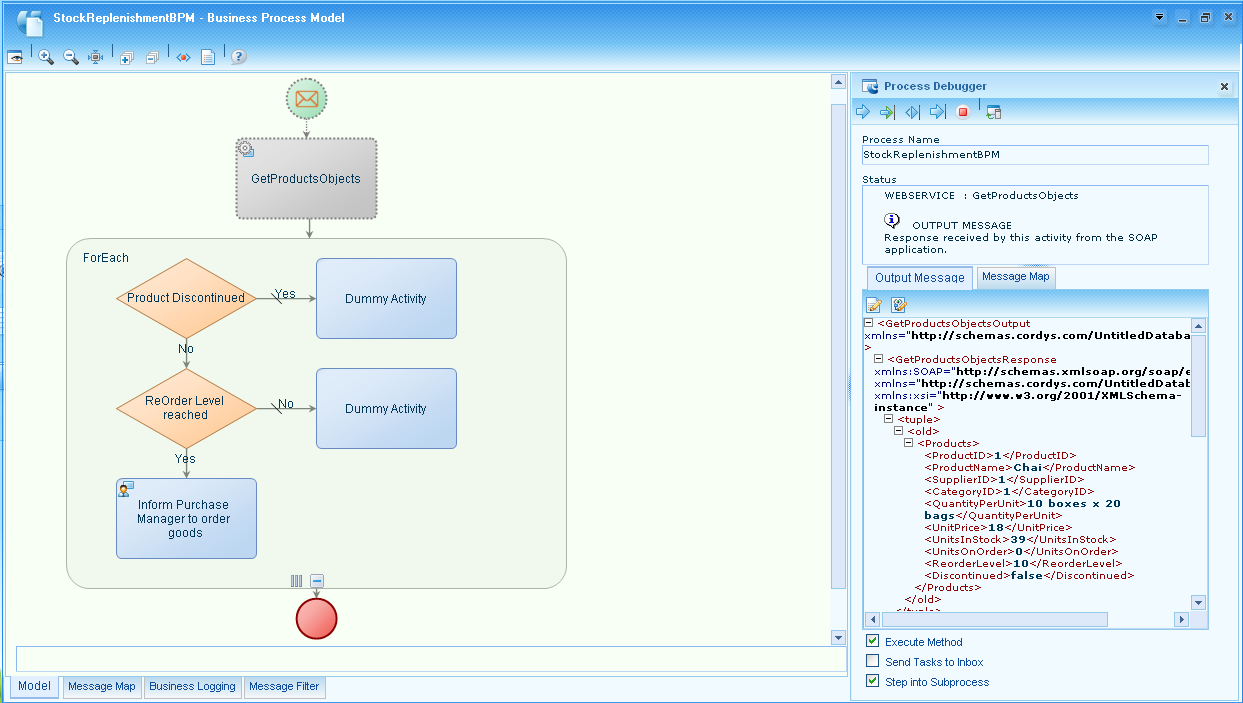
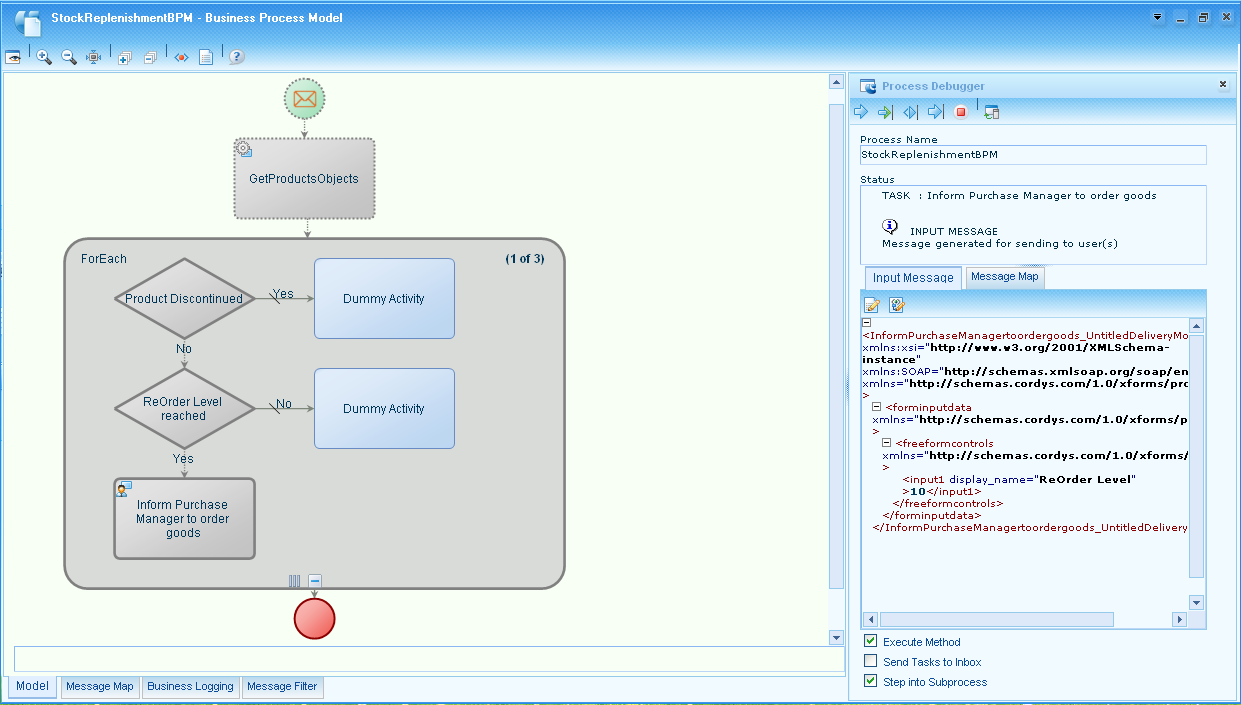
 ) on the Process Debugger toolbar. If you select the Step by Step option, every assignment in the business flow appears in the Status section. The business process appears in the Read Only Editor that has configurable toolbar items. If you select the Activity by Activity option, the debugging starts with the Get Products activity, as shown in the following figure:
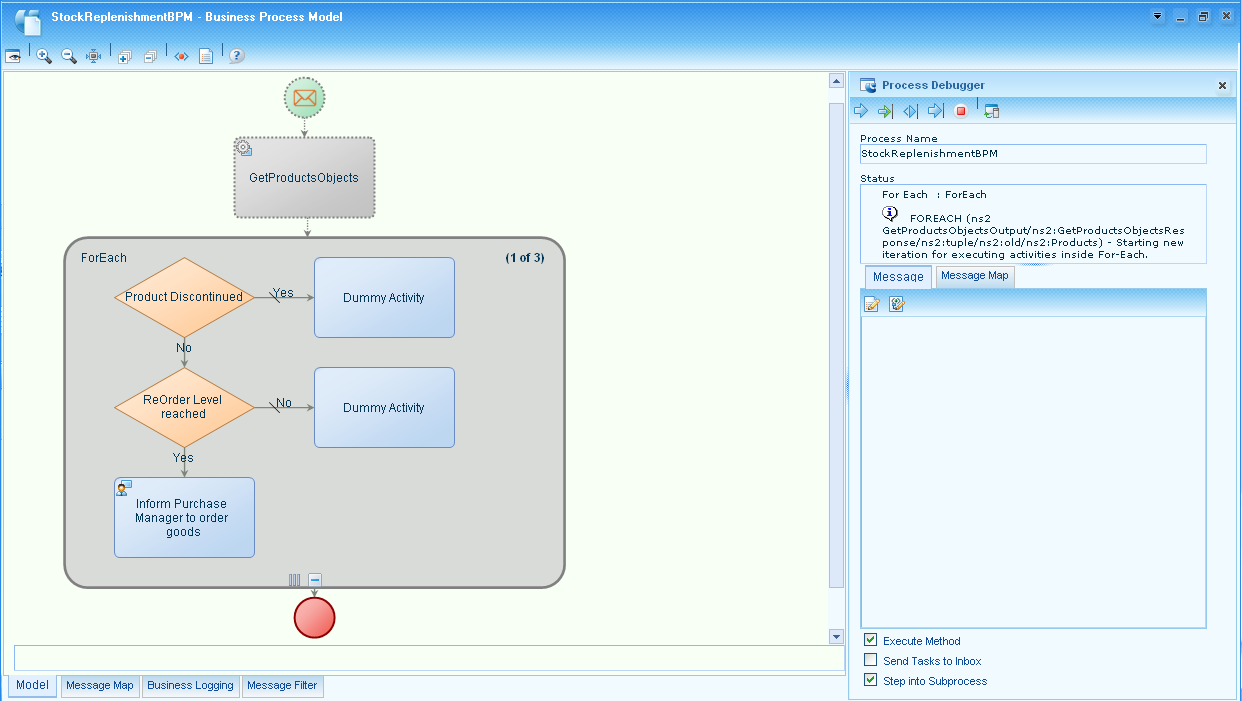
- Click the Activity by Activity icon again to debug the next activity. The Process Debugger checks the For Each loop. The debugger at this stage appears as follows:
- The debugger checks for the Products Discontinued activity in the For Each loop.
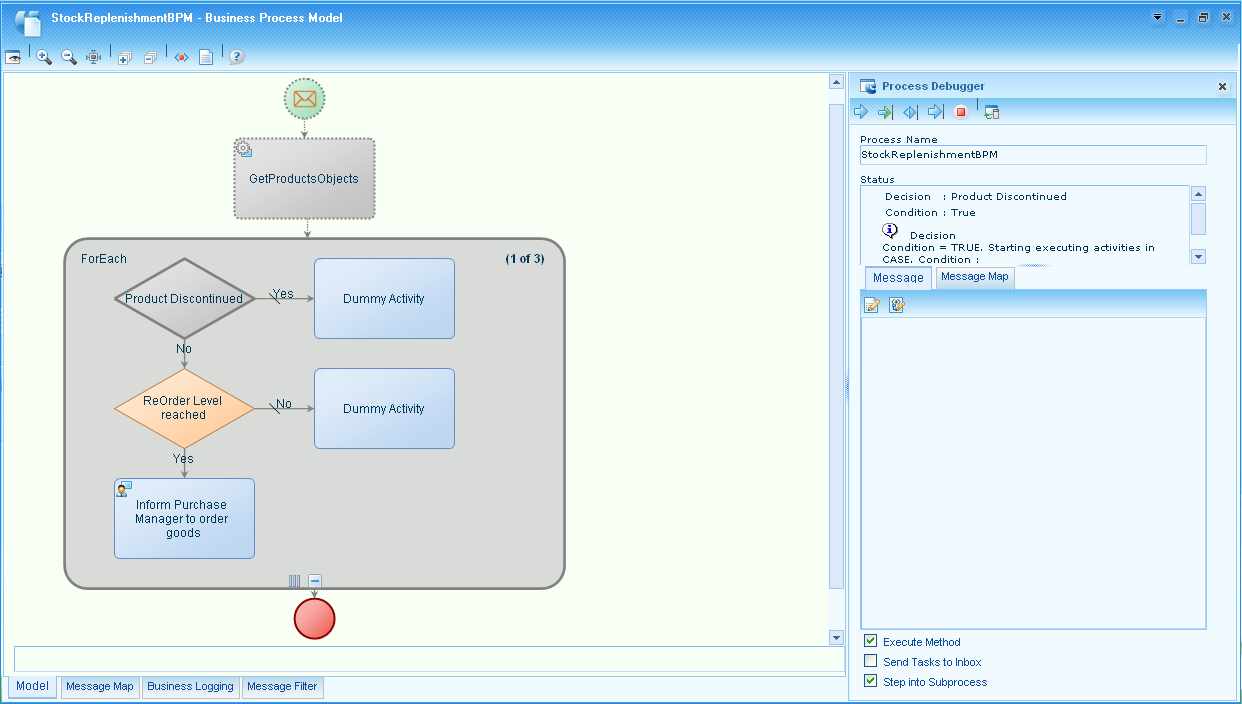
- Since the product is not discontinued in the first iteration of the For Each loop, the debugger checks the ReOrder Level reached activity. The debugger at this stage appears as follows:
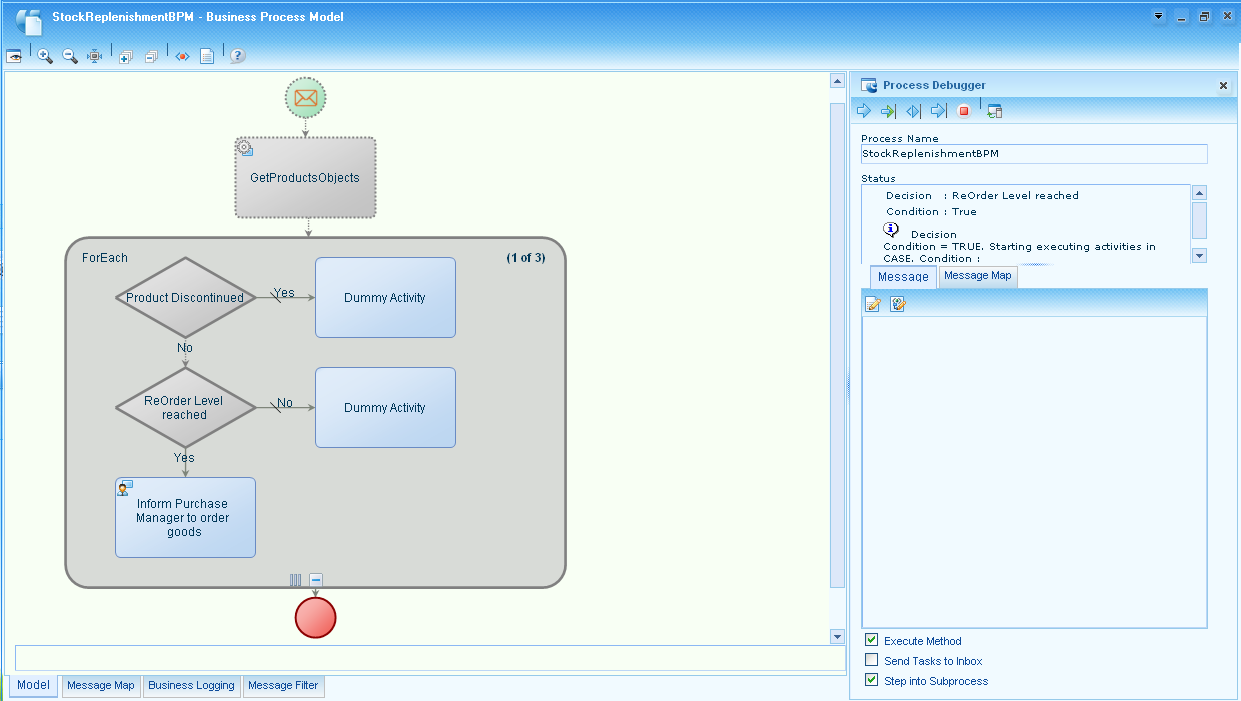
- Since the reorder level is reached - Units in Stock (3) is less than the Reorder Level (5), a notification is sent to the Purchase Manager to reorder stock.
- The Purchase Manager receives the following notification:
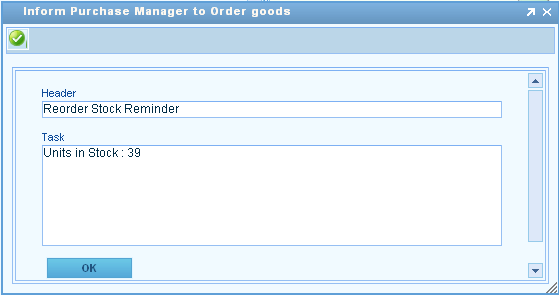
After completing one iteration, the debugger returns to the next iteration and repeats the steps described in the example above.